Back to Projects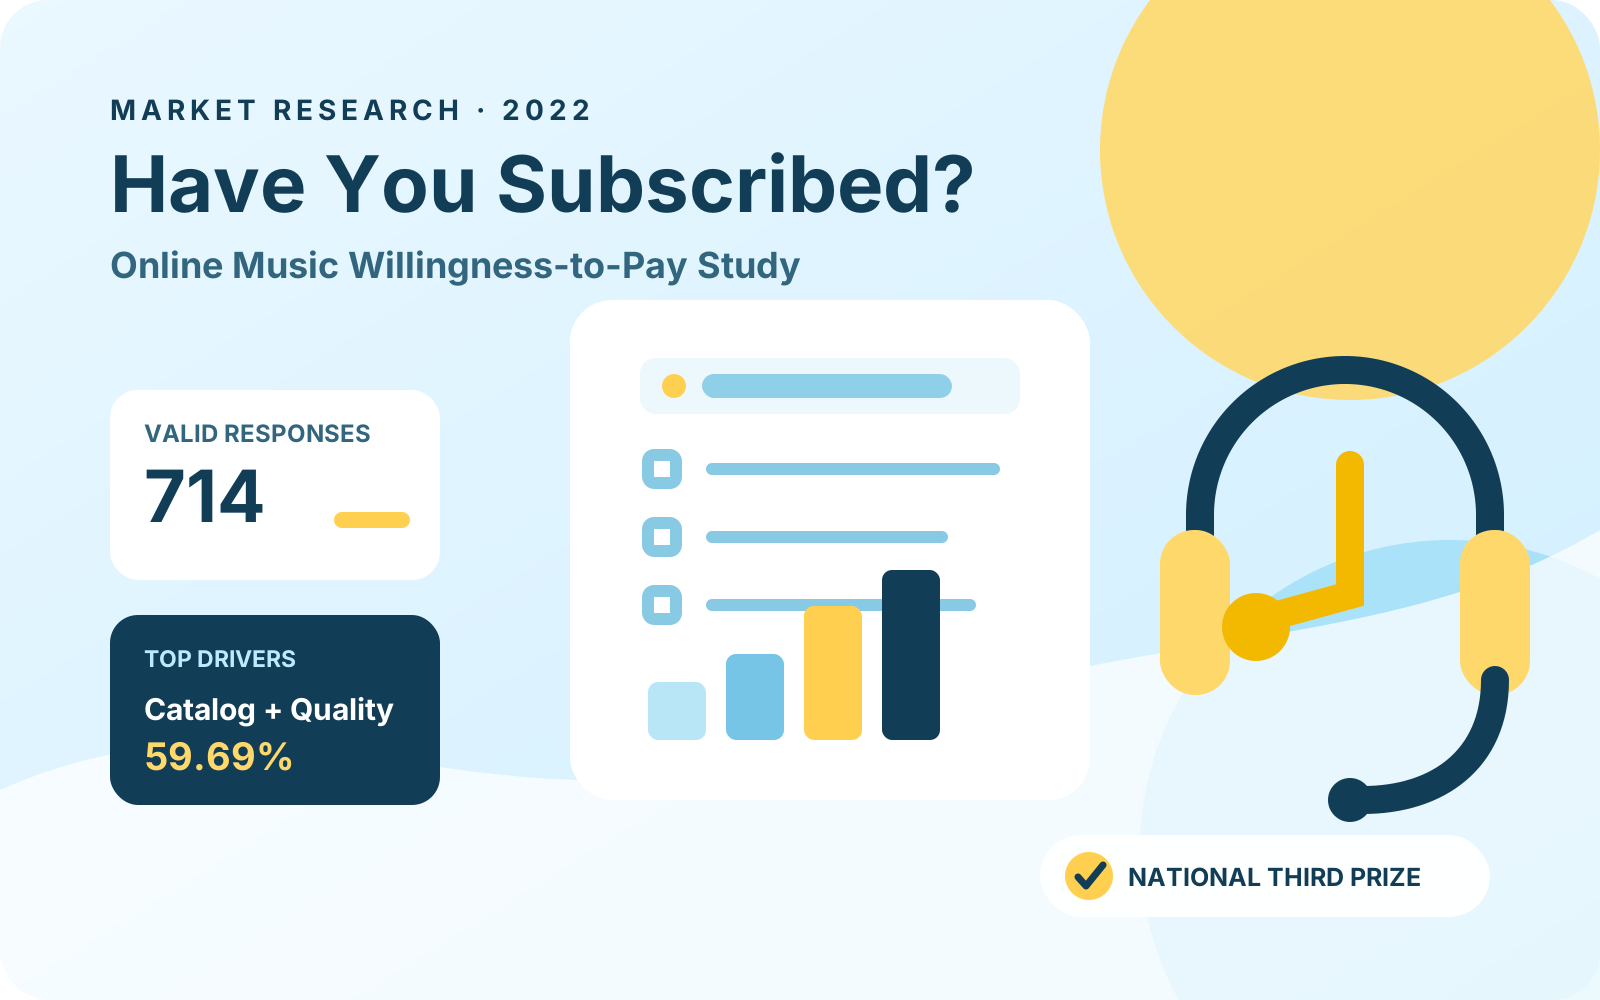
“Have You Subscribed?” | Online Music Willingness-to-Pay Study
From survey research to online music payment drivers
Research Topic, Survey Design & Random Forest Analysis
Jan 2022 – Feb 2022
5-person team
National Third Prize | National Market Survey and Analysis Competition
2022-04-12
Questionnaire Design
SPSS
Reliability & Validity Testing
Random Forest
Market Research
Survey Research
User Research
Data Analysis
Case at a Glance
“Have You Subscribed?” | Online Music Willingness-to-Pay Study
- Background / Problem
- As online music shifted from free access toward paid consumption, platforms needed to understand who would pay, which behavioral and psychological factors created attraction, and how needs differed across user groups.
- My Role & Scope
- I proposed the topic selected by the team and owned report Chapters 4, 5, 6, and 10, the related conclusions and recommendations in Chapter 12, and the corresponding presentation sections.
- Key Decisions / Actions
- Designed a four-part questionnaire and a stratified, multistage survey covering university students and residents
- Ran 50-response pilot studies for each group and checked discrimination, reliability, validity, and sample randomness
- Used a random forest to compare seven payment drivers and student-resident differences, then wrote recommendations on catalogs, sound quality, and the student segment
- Result / Validation Status Delivered
- The formal study distributed 800 questionnaires, recovered 740, and retained 714 valid responses. The model identified catalogs and sound quality as the leading drivers, and the project received a national third prize.
- Key Outputs
- Survey plan, questionnaire, and quality testing Available
- Formal survey and random-forest driver analysis Available
- Related conclusions and strategic recommendations Available
- National third prize Available
- Publishable report and presentation attachments Pending
Project Overview
This online music willingness-to-pay study was completed in 2022 by the five-person Serendipity team and received a national third prize in China’s National College Student Market Survey and Analysis Competition. Every member proposed possible topics; the team selected mine: analyzing online music payment from the user’s perspective through behavioral characteristics and consumer psychology. I owned report Chapters 4, 5, 6, and 10—survey and questionnaire design, pilot reliability and validity testing, the formal survey, and random-forest driver analysis—plus the related Chapter 12 conclusions and recommendations and the corresponding presentation sections.
Pain Points & Opportunities
China’s online music market was moving from free access toward paid consumption. Gaming, film, animation, short video, and livestreaming were strengthening payment awareness across digital entertainment, yet paid online music grew more slowly and models such as subscriptions and digital albums were still evolving. Platforms needed to understand more than whether people listened: they needed to know how usage became willingness to pay, which benefits users valued, and how consumer psychology differed between students and residents.
Goals & Metrics
The study pursued three levels of insight: describe online music usage and payment, identify behavioral and psychological characteristics of potential paying users, and compare how segments valued seven driver categories—catalog resources, sound quality, artists, paid services, consumption habits, moral judgment, and values. The resulting evidence informed product and market recommendations. These are findings from a 2022 competition project, not a real-time account of the 2026 market.
User Research
I structured the questionnaire around personal information, online music usage, consumption, and subjective willingness to pay, then designed a multistage sampling plan across student and resident strata. Before the formal survey, each group completed 50 pilot questionnaires. All item-discrimination tests reached p < 0.05; Cronbach’s alpha across 13 scale items was 0.913; KMO was 0.867; and Bartlett’s test was significant. The formal survey distributed 800 questionnaires and recovered 740, a 92.5% response rate. It retained 714 valid responses, a 96.48% validity rate. The three formal subscales each had alpha above 0.7; KMO was 0.716; and a runs test returned p = 0.346, giving later analysis an inspectable data foundation.
Solution Design
For the driver analysis I owned, a random forest predicted users’ attraction scores and used a 70/30 train-test split, producing R² = 0.65 on training data and R² = 0.62 on test data. Catalog resources ranked first at 0.3054 importance and sound quality second at 0.2915; together they represented about 59.69%. Artists, consumption habits, paid services, values, and moral judgment followed. I also compared factor ratings between students and residents. Descriptive statistics, binary and ordered choice models, interviews, text mining, and focused platform studies belong to the wider team research chain rather than my individual contribution.
Execution Plan
My work formed an end-to-end path from problem definition to strategy: proposing the selected topic and its behavioral and psychological lens; designing the questionnaire, variables, and student-resident sampling path; revising the scale through pilot testing; checking formal-survey data quality; building the random forest and comparing groups; and writing the corresponding Chapter 10 analysis, related Chapter 12 conclusions and recommendations, and presentation content. The team combined this work with other models, interviews, and platform research to complete the report and defense.
Results Review
The formal survey achieved a 92.5% response rate and a 96.48% valid-response rate. The model identified catalog resources and sound quality as the two leading payment drivers; about 78% of all respondents rated catalog resources four or five out of five, while students rated catalogs, sound quality, and artists higher overall than residents. I translated these findings into recommendations to strengthen licensed, high-quality catalogs, improve sound-quality experiences, and expand the student segment through catalog, artist, and student-specific benefits. The team’s broader survey also found that 56% of respondents were willing to pay. The project received a national third prize in the National College Student Market Survey and Analysis Competition.
Iteration Reflection
The project taught me to turn a worthwhile question into a defensible research chain: questionnaire structure determines what later analysis can answer, pilot reliability and validity determine whether conclusions are credible, and a model must ultimately return to interpretable, actionable user insight. The work still has limits: university students and younger users make up a large share of the sample, while platform conditions and prices reflect 2022. A future iteration would broaden regional and age coverage, add observed conversion, renewal, and retention behavior, and use longitudinal samples to test whether random-forest importance remains stable.
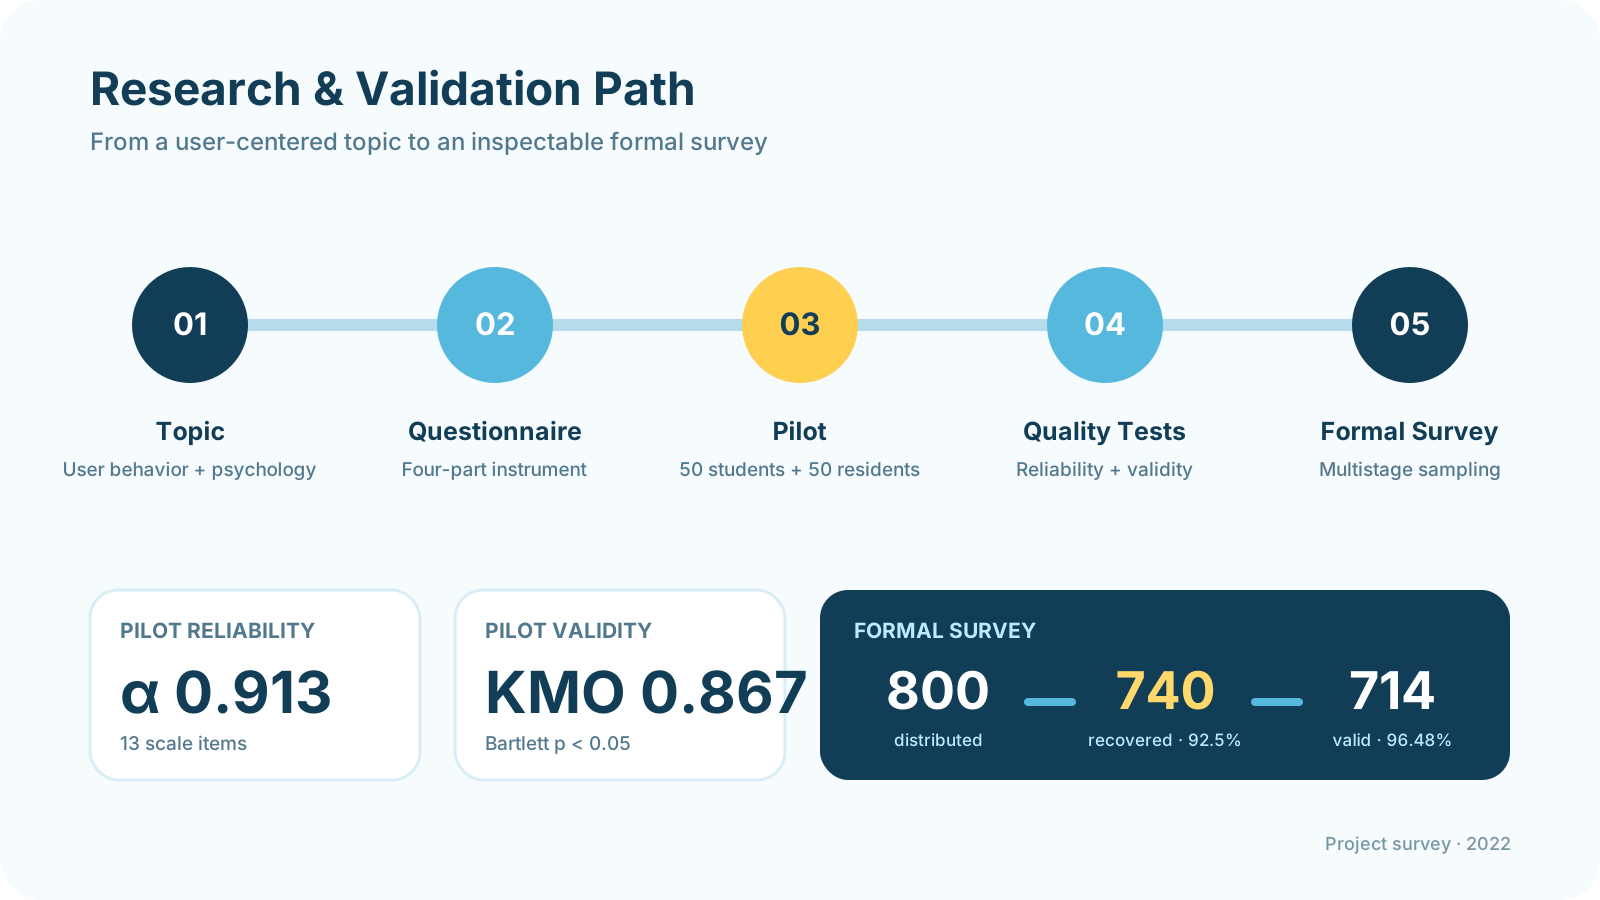 Research and validation path. Source: project survey report (2022).
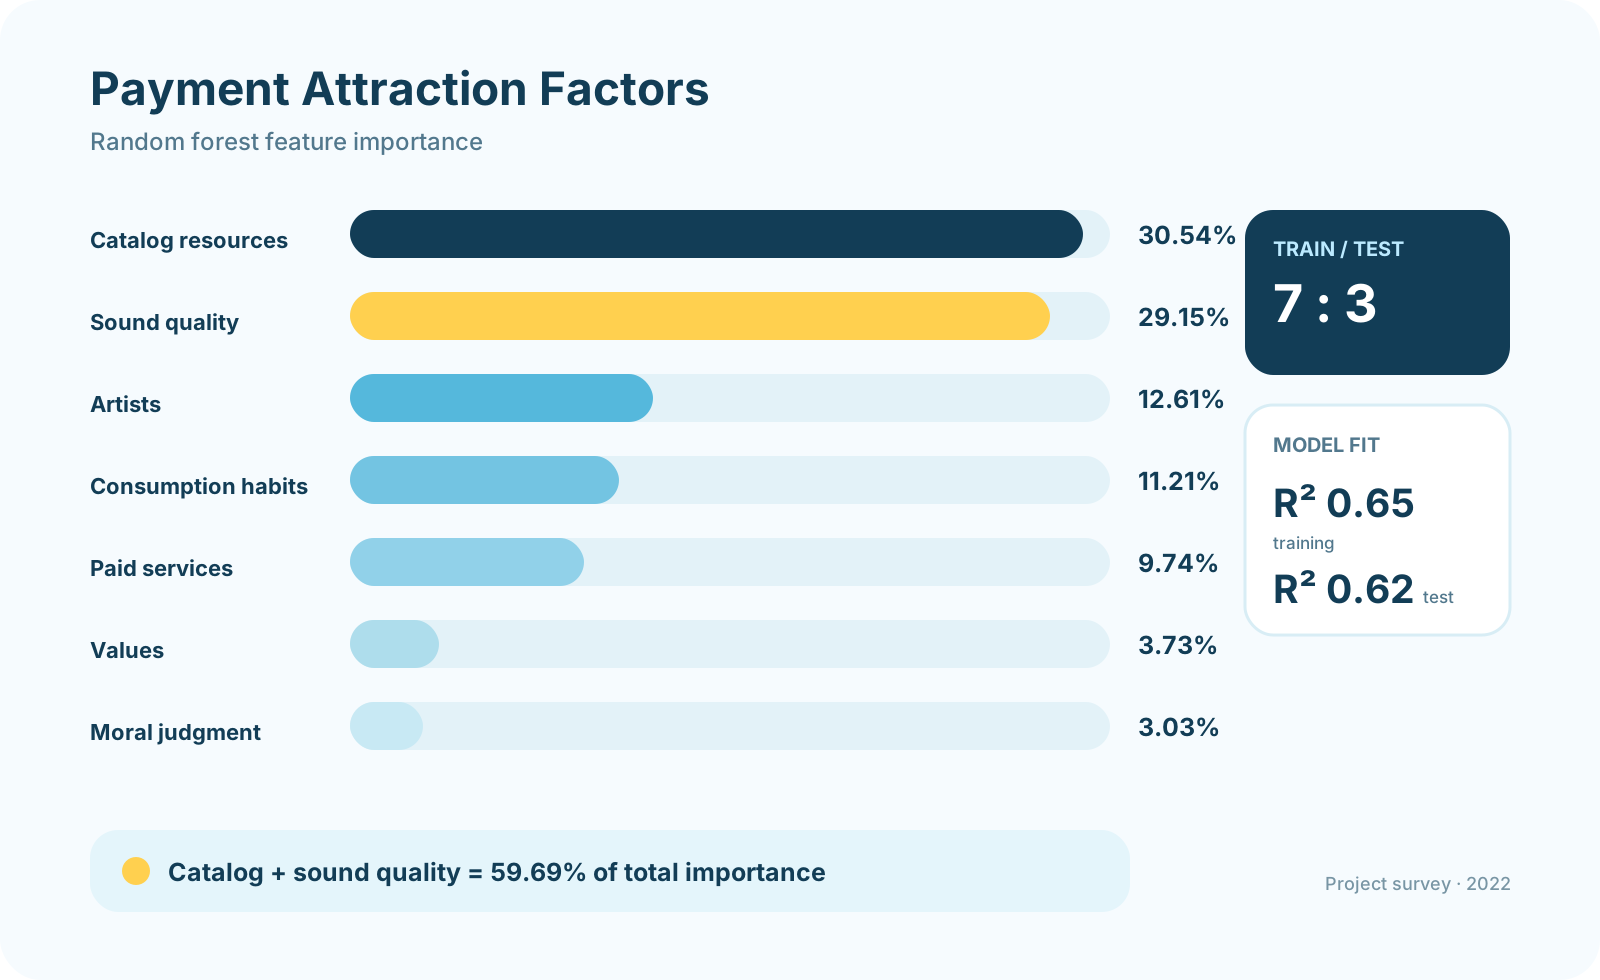 Random-forest factor importance. Source: project survey report (2022).